The history of Wahoo! Results
Everything of significance has an origin story: Superman, Spider-Man, even SWIMS 3.01. This is the origin story of Wahoo! Results — why I wrote it, how it has evolved, and some of the lessons I’ve learned during the process.
Sometimes a project is just a small one. It’s not too complicated; it’s designed to solve a specific, well-defined use-case, and it has a specific end-state (e.g., building a bookshelf). Other times, something that starts as a small project turn into more of an ongoing hobby. As the project progresses and starts to show value, the scope expands, and it evolves over time.
Wahoo! Results started as one of those “I think I can throw something together to solve a problem” projects and became a fun “I wonder what I should add next” project.
Where it started
Everything started (or ended, I suppose) with COVID. During the summer of 2020, lots of folks had extra time on their hands. Some learned knitting, others how to skip rope. In my case, I built a swimming scoreboard.
At the time, my family was swimming with Raleigh Swimming Association — that’s the RSA Wahoos, by the way. Now you know where the name came from.
As we got into the summer of 2020, restrictions eased a bit, practices resumed, and we started having small intrasquad meets. The team had purchased a set of Dolphin watches a few months prior, so we now had electronic timing, but no way to display the results.
There happened to be a large TV on deck that was primarily used for instruction or to review swimming footage. At one of these intrasquad meets, I brought an AnyCast device and decised to mirror the Dolphin window to the TV— I mean, why not show some times, right? Well, it turned out to be a big hit with both the swimmers and the coaches. Everyone enjoyed seeing the results at the end of the race.
To make it more “scoreboard-ish”, I wrote a quick program, events2dolphin, for our next meet that would take a start list and write the event list to CSV for the Dolphin software. This meant that at the next meet, we had the event name and heat displayed on our makeshift “scoreboard.”
Evolution of the scoreboard
Having just started with Python programming, I was looking for a good project to build some experience. It seemed to have the pre-requisites I was looking for in building a real scoreboard:
- I could build a Windows executable (and not rely on Python + libraries being installed)
- Python has an extensive library ecosystem
- It includes a library for developing GUIs (tkinter)
The early days

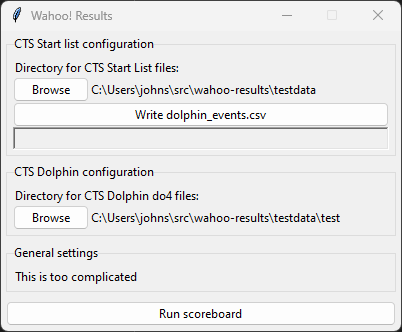
The first iteration lacked a bit of polish to say the least… Shown here is the first tagged version of the code. I was just happy to be able to get the text up on the screen at this point. The app had a minimal set of configuration options, and the scoreboard was just displayed in a window that the user had to maximize and display on the TV (again, via the AnyCast).
With each meet, I added a few more features. Version 0.2.0 added some color to the scoreboard. Version 0.3.0 brought a true full-screen mode and the ability to hide final times that had inconsistent watch times.
Across these versions, I also switched from using the AnyCast to a (comically long) HDMI cable. The wireless connection was just too unreliable and would drop out in the middle of races or cause the laptop to freeze.
Each version also fixed a few bugs. The most notable was an issue calculating the final time. The scoreboard would sometimes display a time that was 0.01 seconds off from the official time. The root cause turned out to be a floating point rounding error. I eventually switched to using fixed-point arithmetic to avoid the issue.
Enter the Chromecast
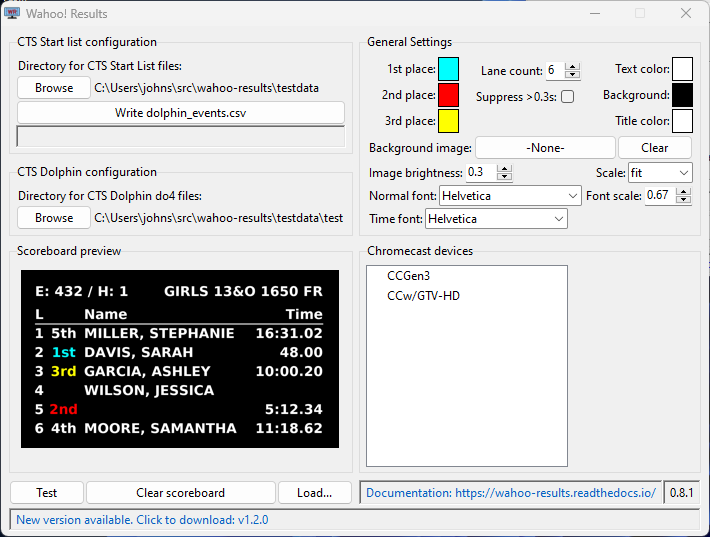
Version 0.5.0 was the first version to support the Google Chromecast. I was tired of tripping over the HDMI cable, and I wanted to be able to move the admin table farther from the TV, so the Chromecast seemed like a good solution.
Switching from displaying the scoreboard in a window to casting it to the TV brought significant changes to the code. The scoreboard image now had to be rendered as a PNG image and made available via a web server so that the Chromecast could retrieve and display it. Previously, it was just drawn on a canvas and displayed in a window.
UI redesign
The jump to version 1.0.0 was notable because it was a complete overhaul of both the UI layout as well as the structure of the code behind it.
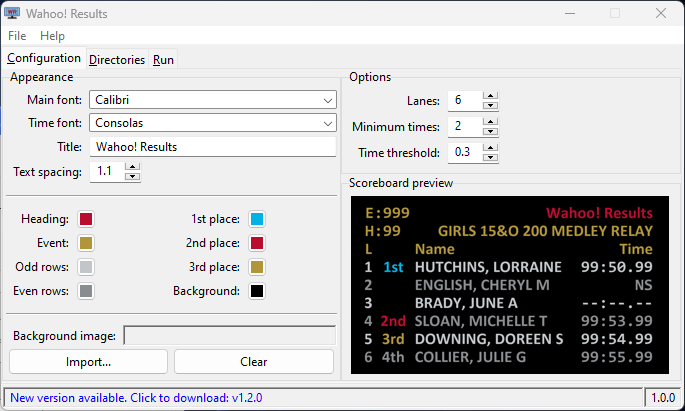
When I started work on the scoreboard, I had very little experience with properly structuring UI code. While I had at least heard of the MVC design pattern, I wasn't familiar enough with its benefits to pursue it. As a result, the UI code was mixed in with the program logic, making it difficult to maintain and extend. This seems to be a case where I failed to consider Chesteron’s fence: there's a reason the pattern is used even though there is a cost to implementing it.
So, with version 1.0.0, I took the time to restructure the code, separating the UI, the data model, and the program logic. While there may be more code overall, it has been much easier to maintain and extend.
Lessons learned
While I have gaind a lot of experience in Python programming and GUI development, testing and attempting to release solid code has been my biggest take-away.
Software testing
We all know the we should write plenty of tests, but maintaining that dicipline is difficult. Calculating the final times was a place where it was important to incorporate some unit tests, and those eventually led me to the current fixed-point arithmetic implementation. File parsing was another area of focus, particularly because (to the best of my knowledge) there is no public specification for the Dolphin DO4 file format.
While the above are good unit-level tests, in v1.2.0, I added randomized end-to-end testing. In addition to running the unit tests with each code change, it now runs a scripted set of end-to-end operations, followed by a random set of operations for a configurable amount of time. This automated testing led to v1.2.0 having the highest number of bugs fixed of any release to-date.
Even with the automated tests, releasing a new version is still a bit nerve wracking.
My collection of Chromecasts
Over the course of the project, I have managed to build a small collection of various Chromecasts to test with. I initially developed with a 1st generation Chromecast because that's what I owned at the time. I then acquired a 3rd generation Chromecast for improved performance. At that point I assumed that what would work on one would work on them all... I was wrong.
After introducing someone to the scoreboard, I advised them to buy the latest Chromecast device (a Chromecast with GoogleTV), and I just assumed it would work without any problems. Well, when they attempted to use it, they had a terrible time. The scoreboard display would go blank or return to the ambient slideshow every few minutes during the meet.
This led me to expand my collection of devices and dig into the problem. It turns out that these devices seem to have a different method for detecting when the screen is idle, so the method that I use in Wahoo! Results doesn't work on these devices. The result was a workaround described on the compatibility page and a bug report to Google.
What's next
Unfortunately, our family no longer swims with RSA, so my access to the Dolphin equipment is limited. However, I still enjoy working on the scoreboard, and I'm happy to see other teams adopting it.
-
I'd love to hear the story behind that one.
 ↩
↩